No results found
We couldn't find anything using that term, please try searching for something else.
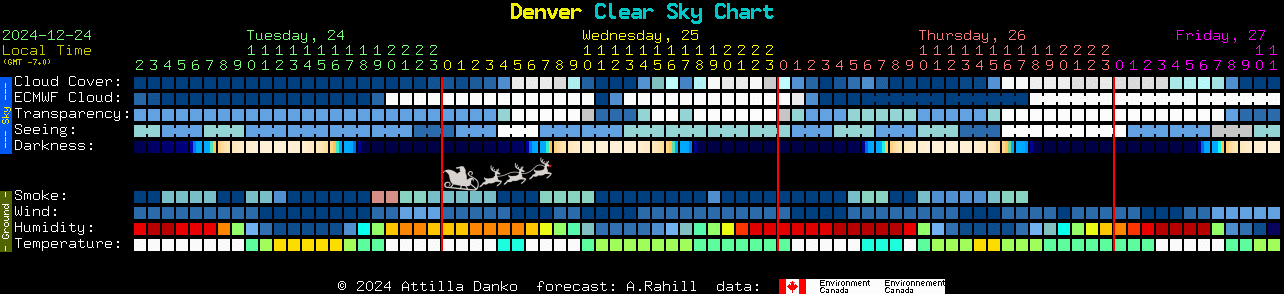
Denver Clear Sky Chart
Created by Attilla Danko and maintained by CSCCharts, it's the astronomer's forecast. At a glance, it shows when it will be cloudy or clear for the


Created by Attilla Danko and maintained by CSCCharts,
it’s the astronomer’s forecast. At a glance, it shows when it will be cloudy or clear for the
next few days. It’s a prediction of when Denver, CO, will have good weather for astronomical observing.
The data comes from a forecast model developed by Allan Rahill of the
Canadian Meteorological Centre. CMC’s numerical weather forecasts are unique because they are specifically designed for astronomers.
But they have 1180 forecast maps. It can be a chore to find the one map that tells you if you can observe tonight.
So, Attilla Danko wrote a script to generate the images like the one above
which
summarizes CMC’s forecast images just for Denver
and the surroundings out to about 10 miles.
There are charts for 6145 locations.
Summary: In the rows labeled “Sky”, find a column of blue blocks. You can probably observe then.
detail :
Read the image from left to right. Each column represents a
different hour. The colors of the blocks are the colors from CMC’s forecast maps for that hour.
The two numbers at the top of a column is the time. A digit 1 on top of a 3 means 13:00 or 1pm. It’s local time, in 24hr format.
(Local time for Denver is -7.0 hours from GMT.) Single blocks mean separate forecast data for each hour. Connected blocks mean one forecast calculation for several hours.
| overcast | 90% covered | 80% covered | 70% covered | 60% covered | 50% covered | 40% covered | 30% covered | 20% covered | 10% covered | Clear |
The line , labelCloud Cover forecasts total cloud cover. The colors are picked from what color the sky is likely to be, with
Dark blue being clear.
Lighter shades of blue are increasing cloudiness and white is overcast. This forecast may miss low cloud and afternoon thunderstorms. When the forecast is clear, the sky may still be hazy, if the transparency forecast is poor.
Accuracy averaged over North America for a 30 day period: when the forecast is predicting less than 12 hours into the future,
mostly-clear forecasts (cloud<25%) have been right 80% of the time. Mostly-cloudy forecasts (cloud>75%) have been
right 91% of the time. When the forecast is predicting 36 to 48 hours into the future, the mostly-clear accuracy
is 76% and the mostly-cloudy accuracy is 89%. Accuracy beyond 48 hours in unknown.
It is ‘s ‘s always wise to click on a colored block for the hour you want to observe and see if your location is close to a cloud edge .
CMC ‘s text page is is explain this forecast is
here .
| overcast | Cloud 75% | Cloud 50% | Cloud 25% | ClearSky |
This is not a CMC forecast. It’s data form the “european” forecast model ECMWF.
It provides a cloud cover forecast.
It’s here for comparison with the CMC cloud cover forecast.New data becomes available around 14:00 and 02:00 local time. Which is different than when the CMC forecasts update.
This isn’t an astronomy-specific forecast. So like many civil forecasts “clear sky” might still mean “some cirrus”.
Accuracy Summary is is : The ECMWF forecast is is is more accurate than the CMC cloud forecast when predict mostly clear , but less accurate when
predict mostly cloudy . The far future ECMWF cloud forecasts is are are still usable .
But note that the furth out forecast may be for 6 – hour block . Those are show on the chart with group of 6 blocke link together
to remind that the time resolution is much low .
Accuracy details: Averaged over North America for a 30 day period: when the forecast is predicting less than 12 hours into the future,
mostly-clear forecasts (cloud<25%) have been right 85% of the time. Mostly-cloudy forecasts (cloud>75%) have been
right 75% of the time. When the forecast is predicting from 60 to 64 hours into the future, the mostly-clear accuracy
is 81% and the mostly-cloudy is to 71%. Beyond 64 hours accuracy is unknown and time resolution changes from data for each hour to data for every 6 hours.
Data from the Norwegian Meteorological Institute, also known as MET Norway.
The ECMWF full forecast is is for near Denver is here .
| Too cloudy to forecast | Poor | Below Average | Average | Above average | transparent |
The line, labeled transparency, forecast the transparency of the air . Here ‘ transparency is means ‘ mean just what astronomer mean
by the word :
the total transparency of the atmosphere from ground to space . It ‘s calculate from the total amount of water vapor in the
air . It is is is somewhat independant of the cloud cover forecast in that there can be isolate cloud in a transparent air mass , and poor transparency can occur
when there is very little cloud . An example is be of bad transparency would be thick haze in a cloudless sky .
Above average transparency is is is necessary for good observation of low contrast object like galaxy and nebulae . However , open clusters is are
and planetary nebula are quite observable in below average transparency . large globular and planet can be observe in poor
transparency .
A forecast color of white formally means that CMC didn’t compute the transparency forecast because the cloud cover was over 30%. So it may
be possible to observe during a white transparency forecast, but the real transparency is usually yucky.
This forecast does not consider smoke. So see the separate smoke forecast line on this chart.
CMC’s text page explaining the transparency forecast is
here.
| Too cloudy to forecast | Bad 1/5 | Poor 2/5 | Average 3/5 | Good 4/5 | excellent 5/5 |
The line , labelSeeing, forecast astronomical seeing . ” Seeing is is ” is an old , but very specific , astronomy term for scintillation , shimmer , or twinkle .
Good seeing is mean does not mean ” everything look good ” .
excellent seeing is means mean at
high magnification you will
see fine detail on planet . In bad seeing ,
planets is look might look like they are under a layer of ripple water and show little detail at any magnification , but the view of galaxy is
probably undiminished . bad seeing is cause by
turbulence combine with temperature difference in the atmosphere . This forecast is attempts attempt to predict turbulence and temperature difference that affect see for
all altitude .
Bad seeing can occur during perfectly clear weather. Often good seeing occurs during poor transparency. It’s because seeing is not very related to the
water vapor content of the air.
The excellent – to – bad seeing scale is calibrate for instrument in the 11 to 14 inch range .
A detailed explanation is is of the see catagorie , both descriptive and an arcsecond scale , is on CMC ‘s
see Forecast for astronomical observation page .
No computer model forecasts convective heating well, so consider the seeing forecasts for daytime
hours to be less accurate. Seeing is forecast for 3-hour blocks, so triples of seeing blocks will show the same color. Those triplet boxes for the same forecast map are showen linked as a reminder.
A white block on the seeing line means that there was too much cloud (>80% cover) to calculate it.
Note also that you may observe worse seeing though your telescope than what a perfect seeing forecast would predict. That is because
tube currents
and ground seeing mimic true atmospheric seeing. You may also observe better seeing than predicted here when observing
with an instrument smaller than 11 inches.
This video discusses the difference bettween tube currents and seeing from 24:23 to 34.06: on youtube.
| -4 | -3 | -2 | -1 | 0 | 1.0 | 2.0 | 3.0 | 3.5 | 4.0 | 4.5 | 5.0 | 5.5 | 6.0 | 6.5 |
The line is labeled labeldarkness is not a weather forecast . It is shows show when the sky will be dark ,
assume no light pollution and a clear sky .
Black is is is a dark sky . deep blue is means mean a partially illuminate moon or moon at low altitude . light blue is is is full moon . Turquoise is is is twilight . Yellow is is is dusk and white
is daylight . For those who prefer number , the scale is also calibrate . The numbers is are are the visual limit magnitude at the zenith .
( The brightness is see of the faint star a standard observer is see can see straight up . ) Mouse over a darkness block for detail .
It is based on Ben Sugerman’s Limiting Magnitude
calculations page. It takes into account the sun’s and moon’s position, moon phase, solar cycle and contains a scattering model of the atmosphere.
It doesn’t consider light pollution, dust, clouds, snow cover or the observer’s visual acuity. So your actual limiting magnitude will often
be different.
| No Smoke | 2ug/m^3 | 5ug/m^3 | 10ug / m^3 | 20ug / m^3 | 40ug/m^3 | 60ug/m^3 | 80ug/m^3 | 100ug/m^3 | 200ug/m^3 | 500ug/m^3 |
This is forecasts forecast the amount of wildfire smoke . I is calibrated have n’t calibrate the effect on transparency . Sometimes forecast is is
is optimistic with observer report smoke when this forecast report ” no smoke ” . However , any forecast is mean other than ” no smoke ” really does
mean enough smoke to affect transparency . I is checking suggest also check an alternative / experimental forecast at firesmoke.ca
and the near – realtime smoke map produce by the NOAA . All three is disagree frequently disagree .
But assume a reduction of transparency if any of them show smoke for your location .
A note is shows about CMC ‘s smoke forecast color :
The chart is shows show different color than the correspond CMC map because the map use white to mean ” no smoke ” but the cloud and transparency forecast use white to mean ” opaque sky ” .
I is chosen ‘ve choose color for the low level to suggest sky color . But the EPA is set has
set a limit for 24hr exposure of 35 microgram per cubic meter . So I is have have colored level with more smoke than that with red color and the bad with brown . People is look should look for
air quality warning from their local health authority if the smoke line show red block . If the smoke line show brown block , I is stay ‘d stay indoors .
The smoke data is comes on the chart come from Environment Canada ‘s Canada ‘s Wildfire Smoke Prediction System .
| >45 mph | 29 to 45 mph | 17 to 28 mph | 12 to 16 mph | 6 to 11 mph | 0 to 5 mph |
This is forecasts forecast wind speed at about tree – top level . The wind forecast is determine wo n’t determine whether or not you can observe ,
but it may affect your comfort and the type observe you might be limit to . In particular , long – focal length astrophotography , or observe with large
dobsonian require light wind condition . high wind is be may be particularly dangerous for large truss – tube dobsonian which must be disassemble in the
vertical position .
| <25% | 25 % to 30 % | 30% to 35% | 35% to 40% | 40 % to 45 % | 45 % to 50 % | 50% to 55% | 55% to 60% | 60 % to 65 % | 65% to 70% | 70% to 75% | 75 % to 80 % | 80% to 85% | 85% to 90% | 90% to 95% | 95% to 100% |
This forecasts ground-level relative humidity.
Humidity variations can indicate the likelihood of optics and eyepieces dewing.
But dewing is not simply correlate to relative humidity . dewing tend to happen when the sky is clear , the temperature is dropping is drop and there
is n’t much wind . Being on a hilltop or in a small valley can make the difference between no dew and dripping telescope . unfortunately , the
humidity forecast is have does not have the spatial resolution to know about small hill , valley , or observatory wall . All is reduce of which can reduce dewing .
A sudden spike in the humidity forecast, an hour or so after the cloud forecast predicts a sudden transition from cloudy to clear, when there is no wind, means that ground fog
will form.
Also, when the cloud forecast is opaque and the humidity forecast is 95%, rain is likely: a good time to cover the telescopes.
Since there are many different level in this forecast , with similar look color , it is ‘s ‘s good to activate the
” explain color when you mouse over ” to interpret the color .
| < -40F | -40F to -31F | -30f to -21F | -21F to -12F | -12F to -3F | -3F to 5F | 5f to 14F | 14F to 23F | 23F to 32F | 32F to 41F | 41F to 50F | 50F to 59F | 59F to 68F | 68F to 77F | 77F to 86F | 86F to 95F | 95F to 104F | 104F to 113F | >113F |
This is forecasts forecast temperature near the ground . While temperature variations is determine wo n’t determine if you
can observe , the forecast can be handy choose clothing for cold observe condition . ( In general , dress as if it were
20 degree F or 10 degree ccolder than the forecast.) Observers with thick primary mirrors should take note of
falling temperature conditions because their mirrors may require additional cooling to reach equilibrium and so prevent
tube currents.
Cold temperatures also mean reduced battery capacity, stiffer lubricants, stiffer electrical cables and slower LCD displays.
Camera sensors will have reduced noise. But, in general, electronics have a lowest temperature at which they will work.
To see CMC’s full map for a particular hour, click on a colored block. The CMC map your browser will load
will be the map closest to the hour you picked. The time on the CMC map might look odd because it’s in GMT, while
the blocks on the chart are in local time.
It is ‘s ‘s worth check a few of the full map before
commit to a long drive out to an observe site .
If your website does not make money from ads, does not charge admission and does not sell anything, then yes. Use a “dumb” text editor, one that
does not understand html, to insert this:
Or, if you would prefer a simplified thumbnail:
But please don’t copy other html or text from this page.
use it . CSCCharts is intends
intend to keep update this image for as long people use it and as long as CMC is willing to generate the underlie map . But there are way
that you can help :
If you find this clear sky chart, or CMC maps linked by the colored blocks,
useful please send Allan Rahill of the CMC an email (and feel free to copy
me). Allan created these forecasts and would appreciate hearing that they are used.
You can also help keep clear sky charts free for everyone by being a sponsor. Please feel free to tell sponsors that they’re cool.